

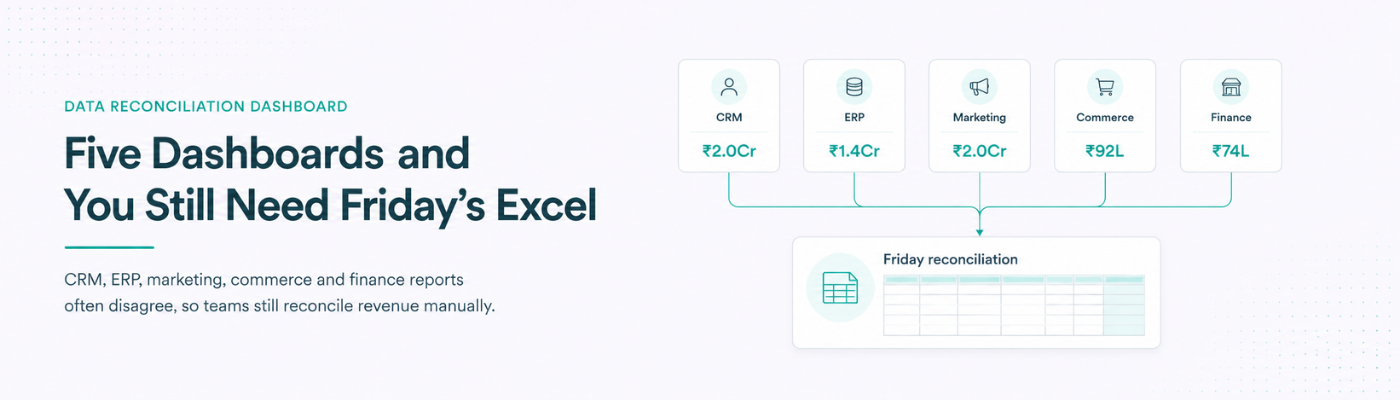
You Have Five Dashboards and Still Need Friday’s Excel
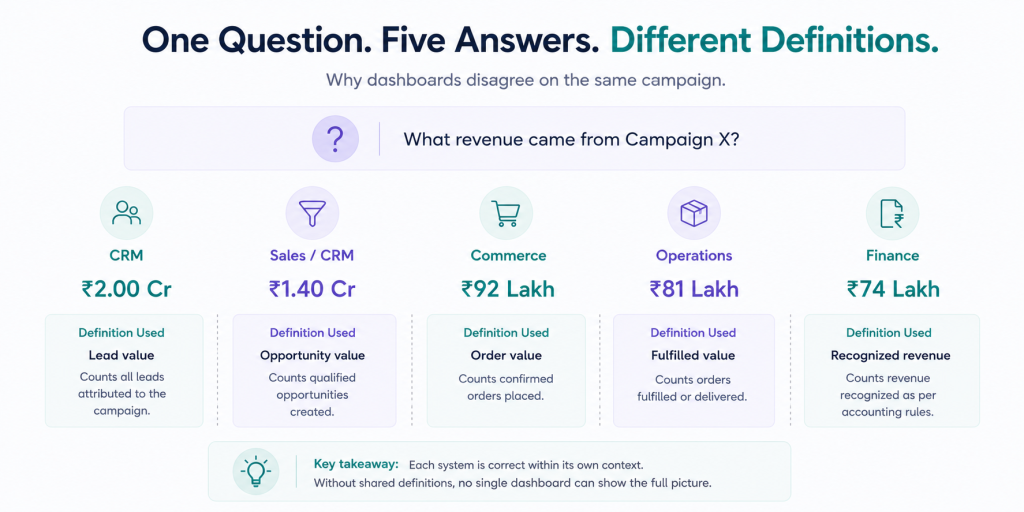
Marketing says the campaign generated ₹2 crore. Sales says it created ₹1.4 crore in opportunities. The commerce dashboard shows ₹92 lakh in orders. Operations reports ₹81 lakh fulfilled. Finance recognizes ₹74 lakh as revenue.
All five numbers may be correct.
That is the problem.
Before Friday’s leadership review, an analyst exports reports from the CRM, ERP, advertising platforms, commerce system and finance software. They remove duplicates, rename branches, adjust dates, exclude cancelled orders and create one final Excel file.
The company has dashboards. Leadership still waits for a spreadsheet.
That is not a reporting problem. It is a data-definition and business intelligence data integration problem.
Every Dashboard Answers a Different Question
Marketing platforms report clicks, leads and attributed conversions. The CRM reports contacts, opportunities and closed deals. Commerce reports orders. Operations reports completed deliveries or fulfilled services. Finance reports recognized revenue.
These systems do not necessarily disagree because one is broken. They disagree because they measure different stages of the same journey.
A campaign may generate a lead in March. Sales may close it in April. The order may be placed in May, delivered in June and recognized as revenue in July. When leadership asks, “How much revenue did this campaign generate?”, every system applies a different date, status and definition.
Without agreed rules, no dashboard can provide a trusted answer.
Why the Numbers Do Not Match
Different definitions
One team counts a submitted form as a lead. Another counts only verified enquiries. Sales counts an account as qualified after a call. Finance recognizes value only after payment or delivery.
The word may be the same. The definition is not.
Different identifiers
The CRM may identify a customer by email address. The ERP may use an account code. Commerce may use an order ID. Finance may use an invoice number.
Without CRM ERP data integration, the business cannot reliably connect the campaign, lead, customer, order, invoice and final revenue.
Different date logic
Dashboards may use lead date, opportunity date, order date, payment date, delivery date or invoice date. Monthly totals change depending on which date is selected.
Different treatment of cancellations and refunds
Marketing may retain the original conversion. Commerce may show the order as completed before a refund. Finance may remove the value from revenue. Operations may still count the transaction as processed.
Different naming conventions
“South Delhi,” “Delhi South,” “SD Branch” and “Branch 14” may refer to the same location. Until those labels are standardized, branch-level reporting remains unreliable.
Duplicate records
The same customer may enter through several campaigns, use different email addresses or be created again by sales. Duplicate records distort lead counts, conversion rates and marketing revenue attribution.
The Hidden Work Behind the Management Report
The final Excel file looks simple because the manual work is invisible.
Before every review, analysts often:
- Export data from multiple systems
- Standardize product and branch names
- Remove duplicate customers
- Match CRM accounts with ERP records
- Exclude cancelled or refunded transactions
- Check missing campaign values
- Adjust date ranges
- Ask departments to explain differences
- Create management notes
- Republish the final number
This work is repeated every week or month because the logic lives inside a spreadsheet or inside one analyst’s knowledge.
The dashboard shows the result. It does not show how much interpretation was required to produce it.
A reliable data reconciliation dashboard should reduce this repeated effort. It should make the transformation rules visible, reusable and governed.
Why Another Dashboard Will Not Fix It
When leaders do not trust the existing dashboards, organizations often build another one.
The new dashboard may have better charts, cleaner filters and more executive-friendly formatting. But if the underlying systems still use conflicting definitions, the new dashboard simply presents the same disagreement more attractively.
The organization first needs agreement on:
- What counts as a lead
- What makes a lead qualified
- What counts as a customer
- Which system owns product and branch names
- When revenue is counted
- How refunds are treated
- How campaigns receive credit
- Which customer identifier connects systems
- Who owns each metric
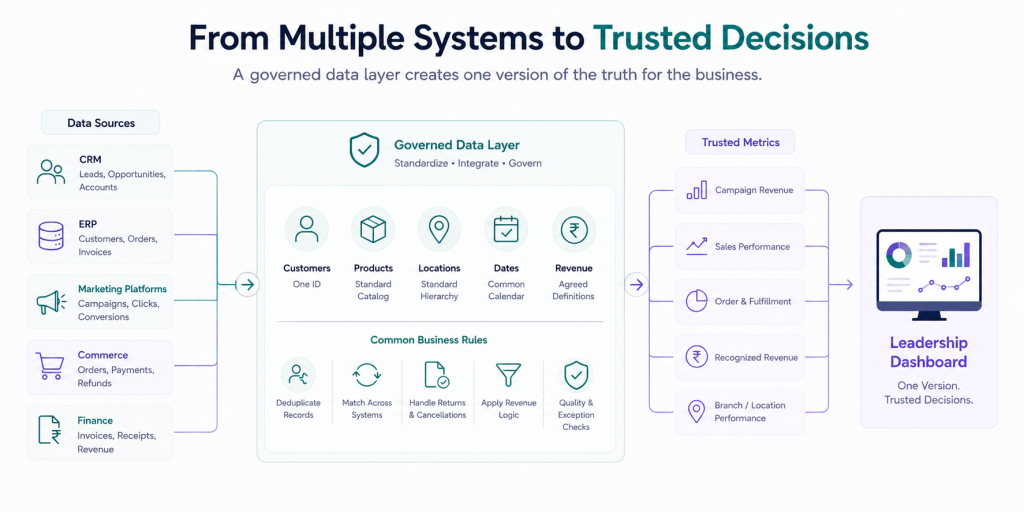
This is the foundation of a single source of truth. It does not mean forcing every team into one software product. It means creating one governed definition for each important business measure.
What a Trusted Data Layer Should Do
Connect the journey across systems
The organization should be able to follow a record from campaign to lead, lead to opportunity, opportunity to order, order to fulfillment and fulfillment to revenue.
That requires dependable CRM ERP data integration and connections with marketing, commerce and operational systems.
Standardize key business entities
Products, customers, locations, campaigns and services should use common identifiers and controlled naming rules.
The dashboard should not rely on analysts manually translating “Branch 14” into “South Delhi” every Friday.
Apply reusable transformation rules
Rules for duplicates, cancellations, revenue recognition, campaign credit and date selection should be applied consistently inside the data layer.
This is what makes data warehouse reporting more dependable than repeated spreadsheet reconciliation.
Show the source and definition
Users should be able to see where a number came from and what it means. A revenue figure should state whether it is booked, fulfilled, invoiced or recognized.
Transparency improves dashboard data quality because disagreements can be traced to the rule or source rather than debated in the meeting.
Surface exceptions
A trusted dashboard should identify records that could not be matched, branches using inconsistent codes, transactions missing campaign information and totals that differ between systems.
Good reporting does not hide data problems. It makes them actionable.
The Five Questions Your Leadership Dashboard Must Answer
A useful data reconciliation dashboard should answer more than “What happened?”
It should show:
- What happened?
- Why did it happen?
- Which systems support the number?
- Where are the unresolved discrepancies?
- What action should the business take next?
For example, a decline in revenue may be caused by fewer leads, slower sales conversion, high cancellations, fulfilment delays or refunds. A single total cannot explain which team needs to act.
This is where business intelligence data integration becomes decision intelligence. The objective is not more reporting. It is faster, more confident action.
Run This Audit Before Building Another Dashboard
Choose one number used in your next leadership meeting – revenue, qualified leads, conversion rate, branch performance or campaign ROI, and trace how it is produced.
Check:
- Which systems contribute data?
- Which date is used?
- Which definition is applied?
- Who owns the final number?
- How are duplicates removed?
- How are cancellations and refunds treated?
- How are CRM records matched with ERP transactions?
- How many manual exports are required?
- Which assumptions exist only inside Excel?
- Can the number be reproduced without the analyst who prepared it?
If the answer depends on personal knowledge, manual edits or several follow-up calls, the company does not yet have a reliable single source of truth.
Where Does Your Growth Stop?
Sometimes growth stops because leadership cannot agree on what happened.
Marketing increases spending because its dashboard shows strong returns. Sales reduces confidence because the leads appear weak. Operations sees fulfillment pressure. Finance reports less realized revenue than anyone expected.
Every team is acting on its own version of the business.
WeAddo’s Data Suite is designed for this gap. It brings together data warehousing, CDP, BI, marketing analytics, data engineering and transformation so leaders can see what happened, why it happened and where to act next. The wider UEP model connects this decision layer with experience and operations rather than treating reporting as a separate dashboard project.
Conclusion
The purpose of a dashboard is not to eliminate Excel completely. It is to eliminate repeated manual reconciliation before every important decision.
A dependable data reconciliation dashboard requires clear definitions, connected customer and transaction records, governed transformation rules and visible exceptions. Strong CRM ERP data integration connects commercial activity with operational and financial outcomes. Effective marketing revenue attribution shows how demand becomes realized value. Reliable data warehouse reporting applies the same rules every time. Better dashboard data quality gives leadership a number it can question, trace and trust.
Take one number from your next management review and document every manual step required to produce it.
That is where your reporting problem actually begins.
Audit one leadership metric and identify every export, adjustment and explanation required before the number becomes usable.
A data reconciliation dashboard compares and combines data from multiple systems, applies shared definitions and highlights differences that require investigation.
CRM systems track leads and opportunities, while ERP systems track orders, invoices and operational transactions. Without CRM ERP data integration, the records and definitions may not connect.
A single source of truth is a governed set of business definitions and data rules used consistently across reporting, even when the underlying data comes from several systems.
Data warehouse reporting centralizes data, standardizes fields and applies repeatable transformation rules before metrics reach dashboards.
Businesses can improve dashboard data quality by defining metric ownership, standardizing identifiers, removing duplicates, documenting transformation rules and exposing unmatched records.






Leave a Reply